From a 900-year-old warning to today
In part 1 I summarised Al-Ghazali's view that money is a tool. It should move, it should be honest, and rulers should not cheat with it. This post checks that idea against real numbers.
Two things stand out. The world is borrowing at record levels. At the same time, a few nations sit on record piles of cash, gold and funds. Both say something about trust.
The world owes $348 trillion
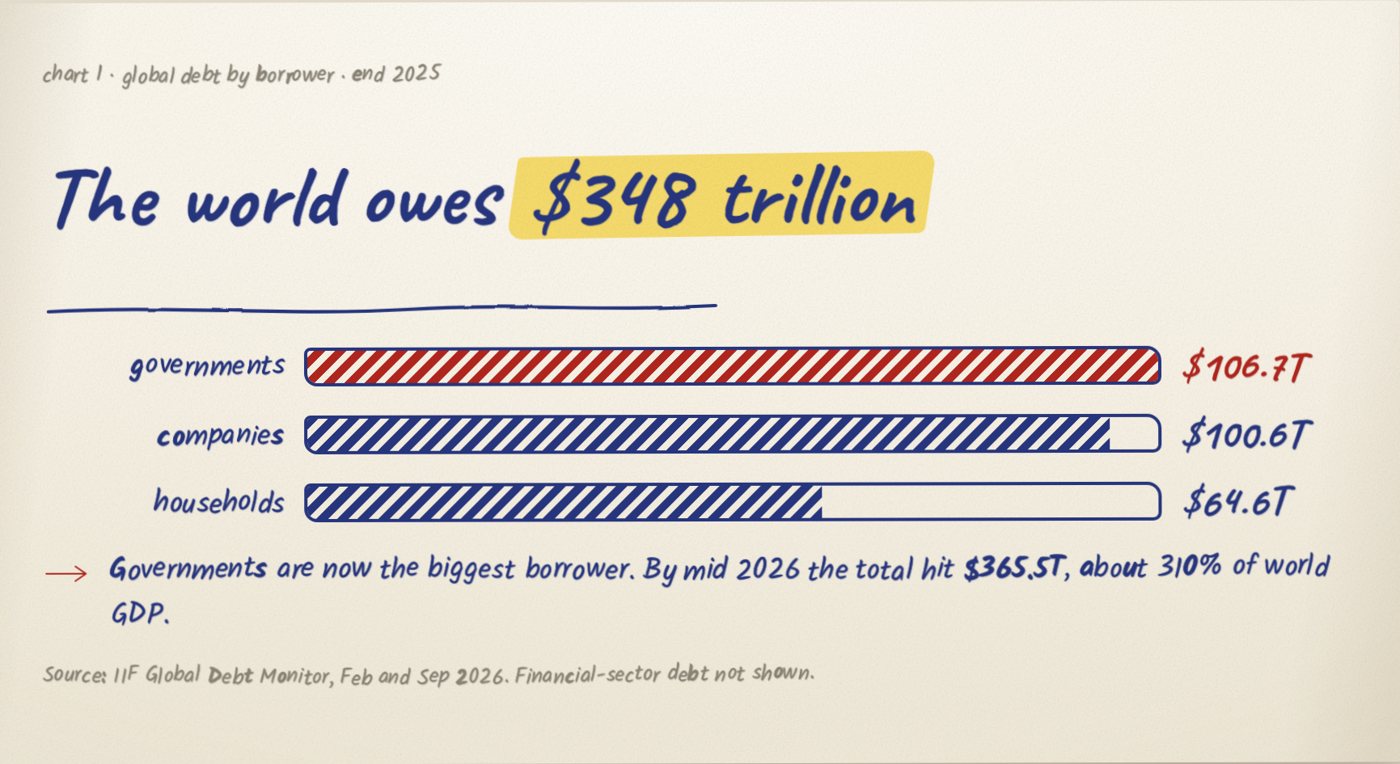
Governments became the largest borrower in 2025 at $106.7T, ahead of companies at $100.6T and households at $64.6T.
By mid 2026 the total reached a record $365.5T. That is roughly 310% of everything the world produces in a year.
Advanced economies paid over $3.3T in interest on government bonds in the past year. The world spent $3.1T on defence in the same period.
Al-Ghazali lens: money spent on interest is money that builds nothing.
Who owes the most
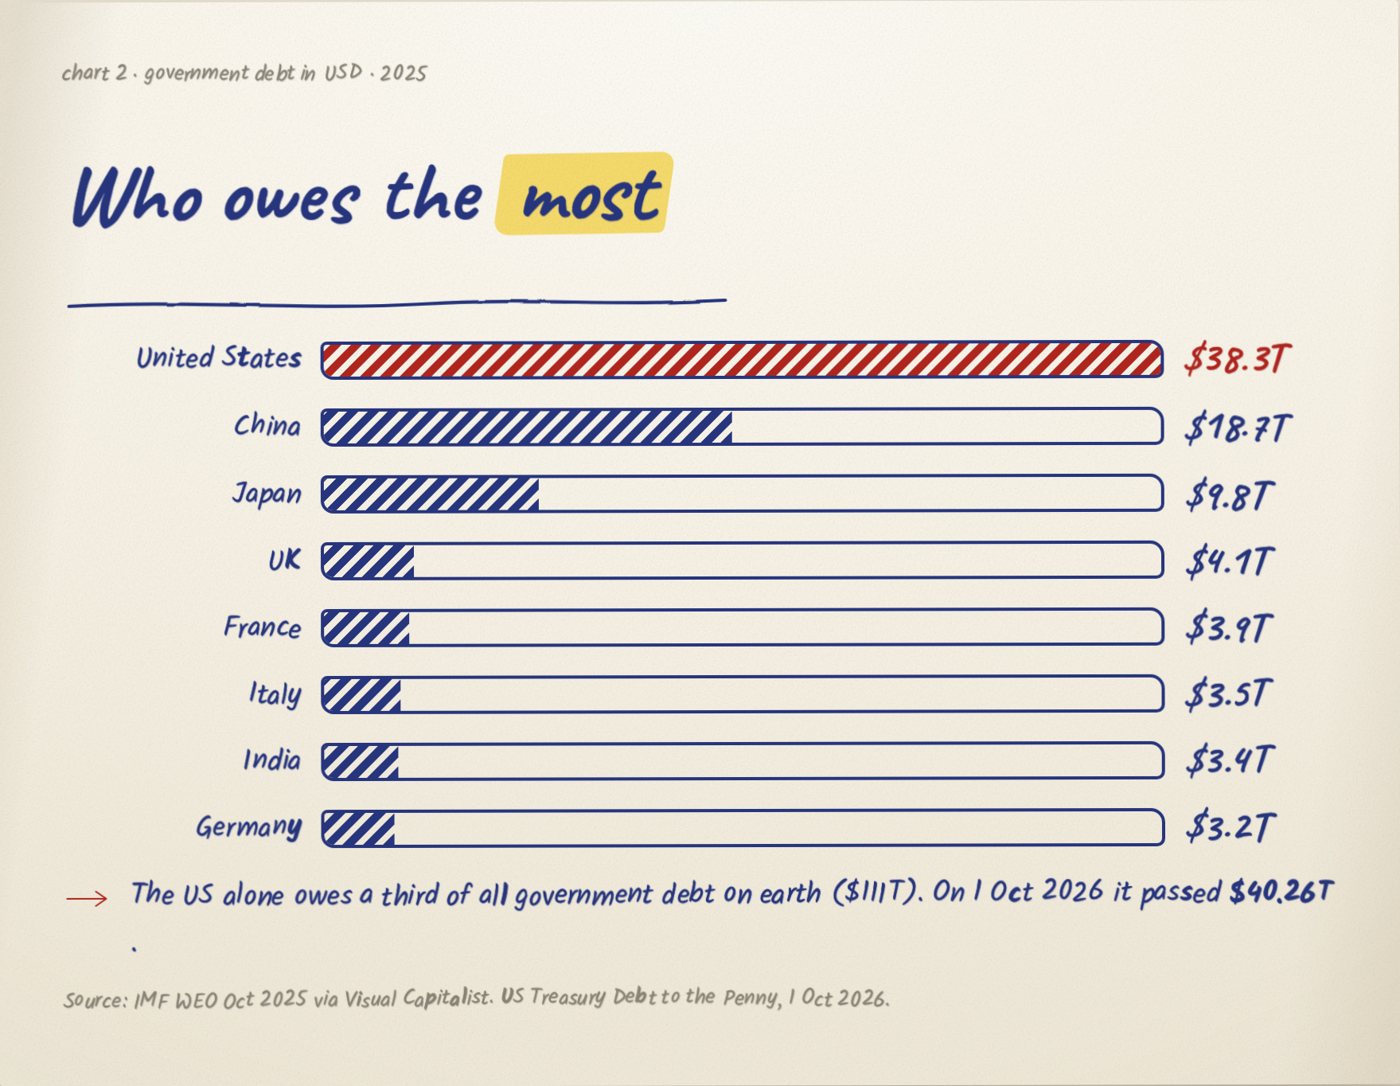
World government debt was about $111T in 2025. The US alone carried $38.3T of it, about a third.
On 1 October 2026, the first day of its new fiscal year, US federal debt passed $40.26T.
The US now spends about $1.04T a year on net interest, according to the CBO. That is more than its $885bn defence budget.
Al-Ghazali lens: a state that borrows to stand still is spending its children's wages.
Debt against the economy
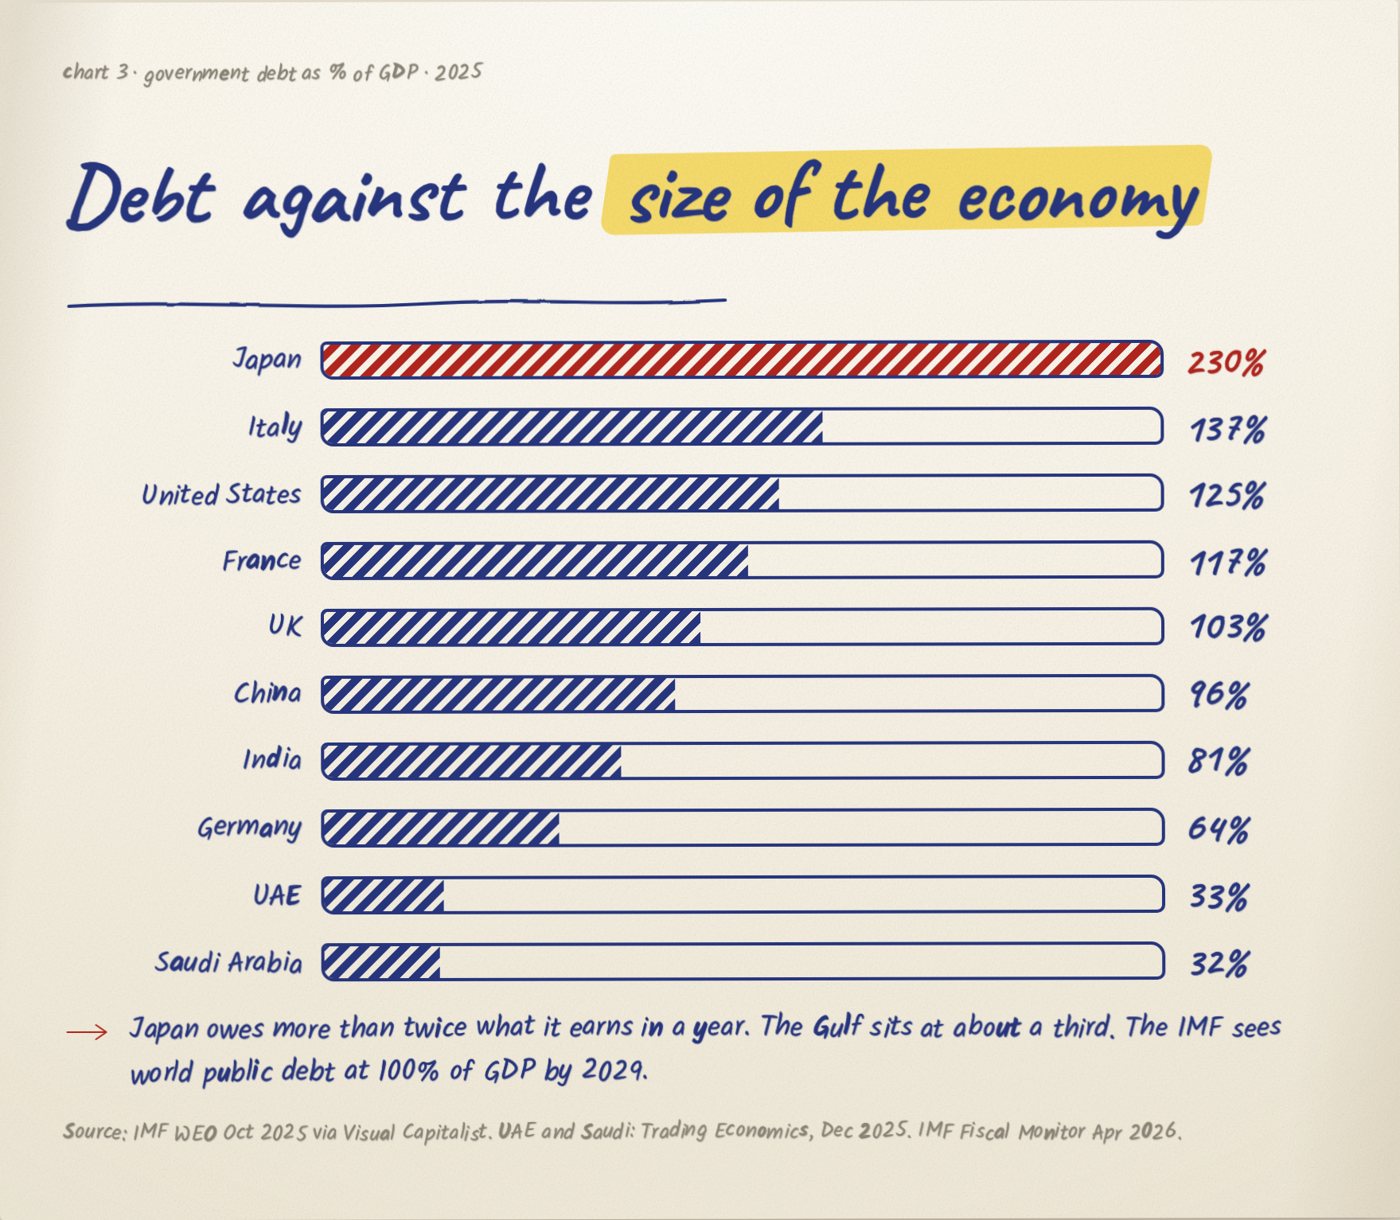
Size alone misleads. Japan owes about 230% of its yearly output, the heaviest load of any big economy.
The Gulf sits at the other end. The UAE and Saudi Arabia carry debt of roughly a third of GDP.
The IMF expects world public debt to reach 100% of GDP by 2029.
Al-Ghazali lens: debt is not the sin. Debt that funds nothing productive is.
Who sits on the cash pile
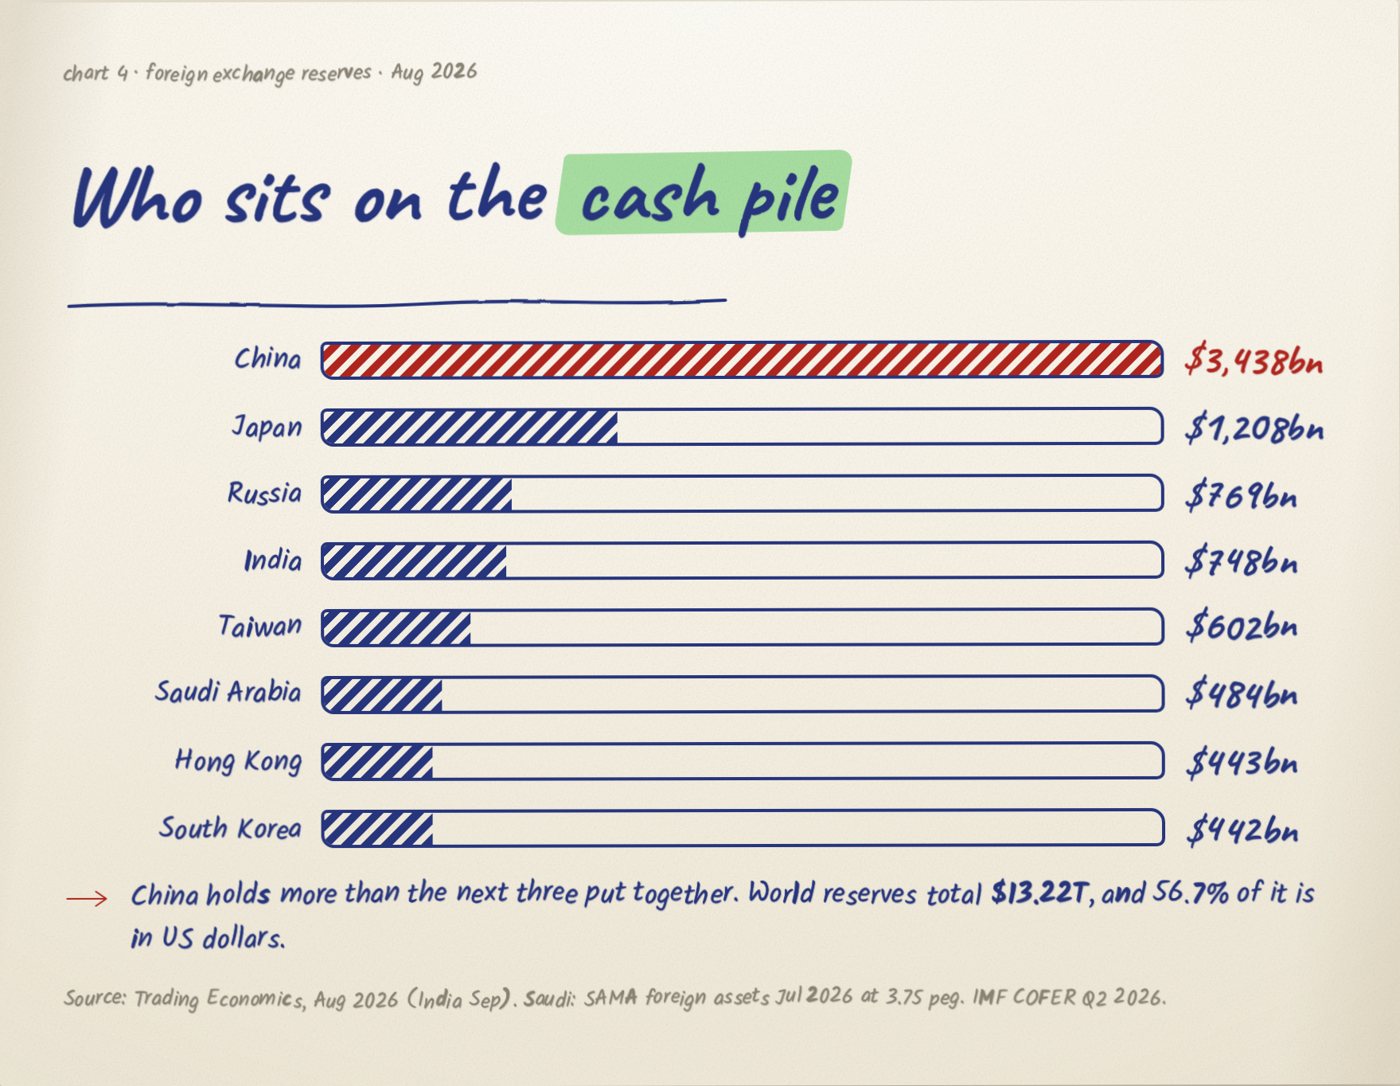
Central banks hold $13.22T in foreign reserves. China holds $3.44T, more than Japan, Russia and India combined.
Most of it is parked in other countries' bonds. 56.7% of world reserves are in US dollars.
Reserves are a safety net. Past a point they become money that leaves the home economy and sits still.
Al-Ghazali lens: hoarded money is dead money, even when a nation does the hoarding.
Central banks are buying gold
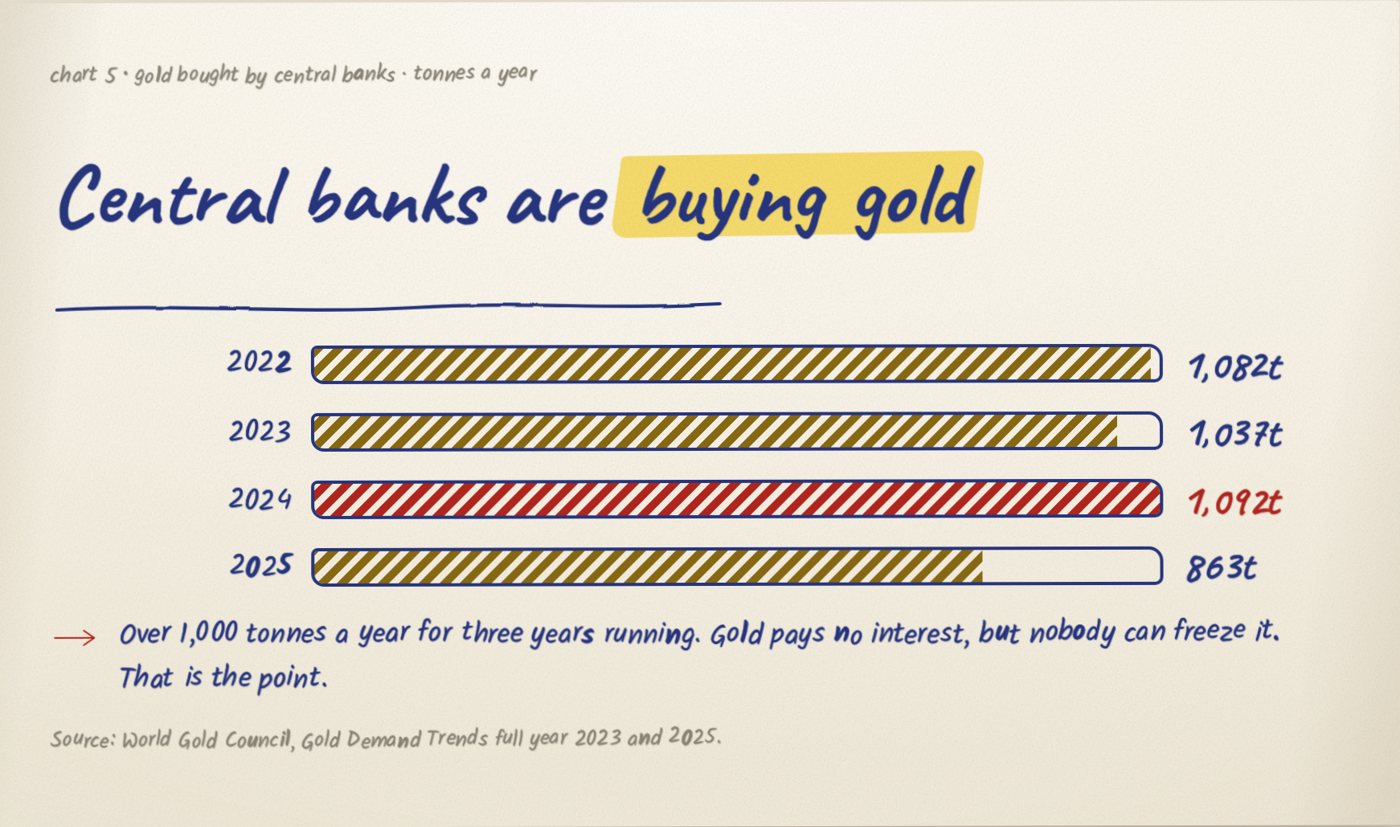
Central banks bought over 1,000 tonnes of gold a year from 2022 to 2024. 2022 set the record. 2025 slowed to 863 tonnes.
The US still holds the most at 8,133 tonnes, ahead of Germany at 3,350.
Gold pays no interest. Banks buy it because nobody can freeze it, the way Russia's dollar reserves were frozen in 2022.
Al-Ghazali lens: when trust in paper falls, people run to metal. He predicted exactly that.
The national savings jars
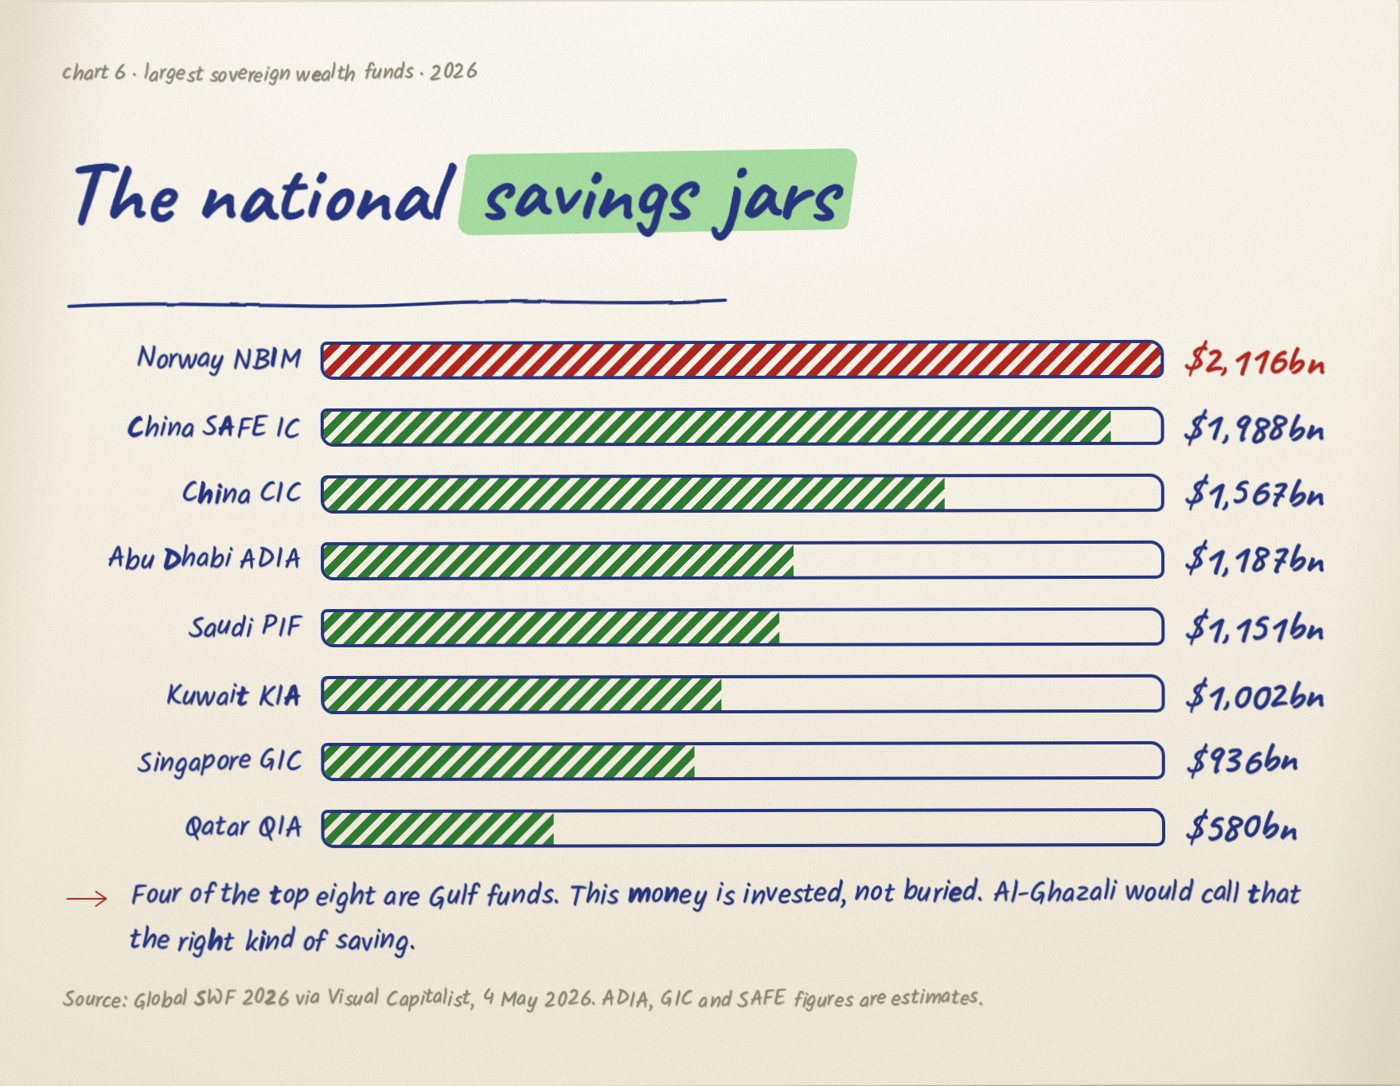
Sovereign funds are the other way to hold a surplus. Norway's $2.1T fund owns slices of thousands of companies and spends only a small share each year.
Four of the top eight are Gulf funds: ADIA, PIF, KIA and QIA, together about $3.9T.
This money is invested, not buried. It funds companies, buildings and jobs around the world.
Al-Ghazali lens: saving that keeps money moving is not hoarding. It is stewardship.
Cash that is waiting
$7.89T sat in US money-market funds in the week to 30 September 2026. It earns interest but waits on the sidelines.
Berkshire Hathaway's cash peaked near $397bn on 31 March 2026, then fell to about $366bn by 30 June as it put money back to work.
What the numbers say
The world is not short of money. It is short of trust. Nations that trust the system borrow. Nations that do not, buy gold and pile up reserves.
Al-Ghazali would split the savers in two. Norway and the Gulf funds keep money working. Reserves parked in foreign bonds and gold in vaults keep it still. The borrowers worry me more. Interest now costs more than defence in the US.
Where each number comes from
- IIF Global Debt Monitor, H1 2026, via Investing.com and Caproasia, Sep 2026.
- IIF, 2025 sector split, via Investing.com, 25 Feb 2026.
- IMF World Economic Outlook Oct 2025, compiled by Visual Capitalist.
- IMF Fiscal Monitor, April 2026.
- UAE and Saudi debt to GDP, Trading Economics, Dec 2025.
- US Treasury Debt to the Penny, 1 Oct 2026, via IndexBox.
- CBO Budget and Economic Outlook, Feb 2026, via American Action Forum.
- FX reserves, Trading Economics, Aug and Sep 2026. Saudi: SAMA via Argaam, Jul 2026, at SAR 3.75.
- IMF COFER, Q2 2026.
- World Gold Council, Gold Demand Trends 2023 and 2025. Holdings: Trading Economics.
- Global SWF 2026 via Visual Capitalist, May 2026. ADIA, GIC and SAFE are estimates.
- ICI money market fund assets, week to 30 Sep 2026. Berkshire: Motley Fool, Sep 2026.